
Retatrutide before and after — real results and what to expect.
Retatrutide before and after results are the most compelling data in modern weight loss pharmacology — and the most frequently misrepresented. The clinical trial numbers are extraordinary: average weight loss of 24% at the highest dose over 48 weeks, with some participants losing over 30% of their body weight. But averages do not tell individual stories, and social media before-and-after posts rarely come with the context needed to set realistic expectations. This guide presents the retatrutide before and after picture honestly — what the trial data actually shows, what realistic results look like at different starting points, the changes that happen beyond the scale, and how to interpret the results you see online.
The information here is based on published phase 2 clinical trial data from Eli Lilly and is consistent with general weight management guidance from the NHS. The representative scenarios below are composite illustrations based on trial data ranges — they are not specific individuals.
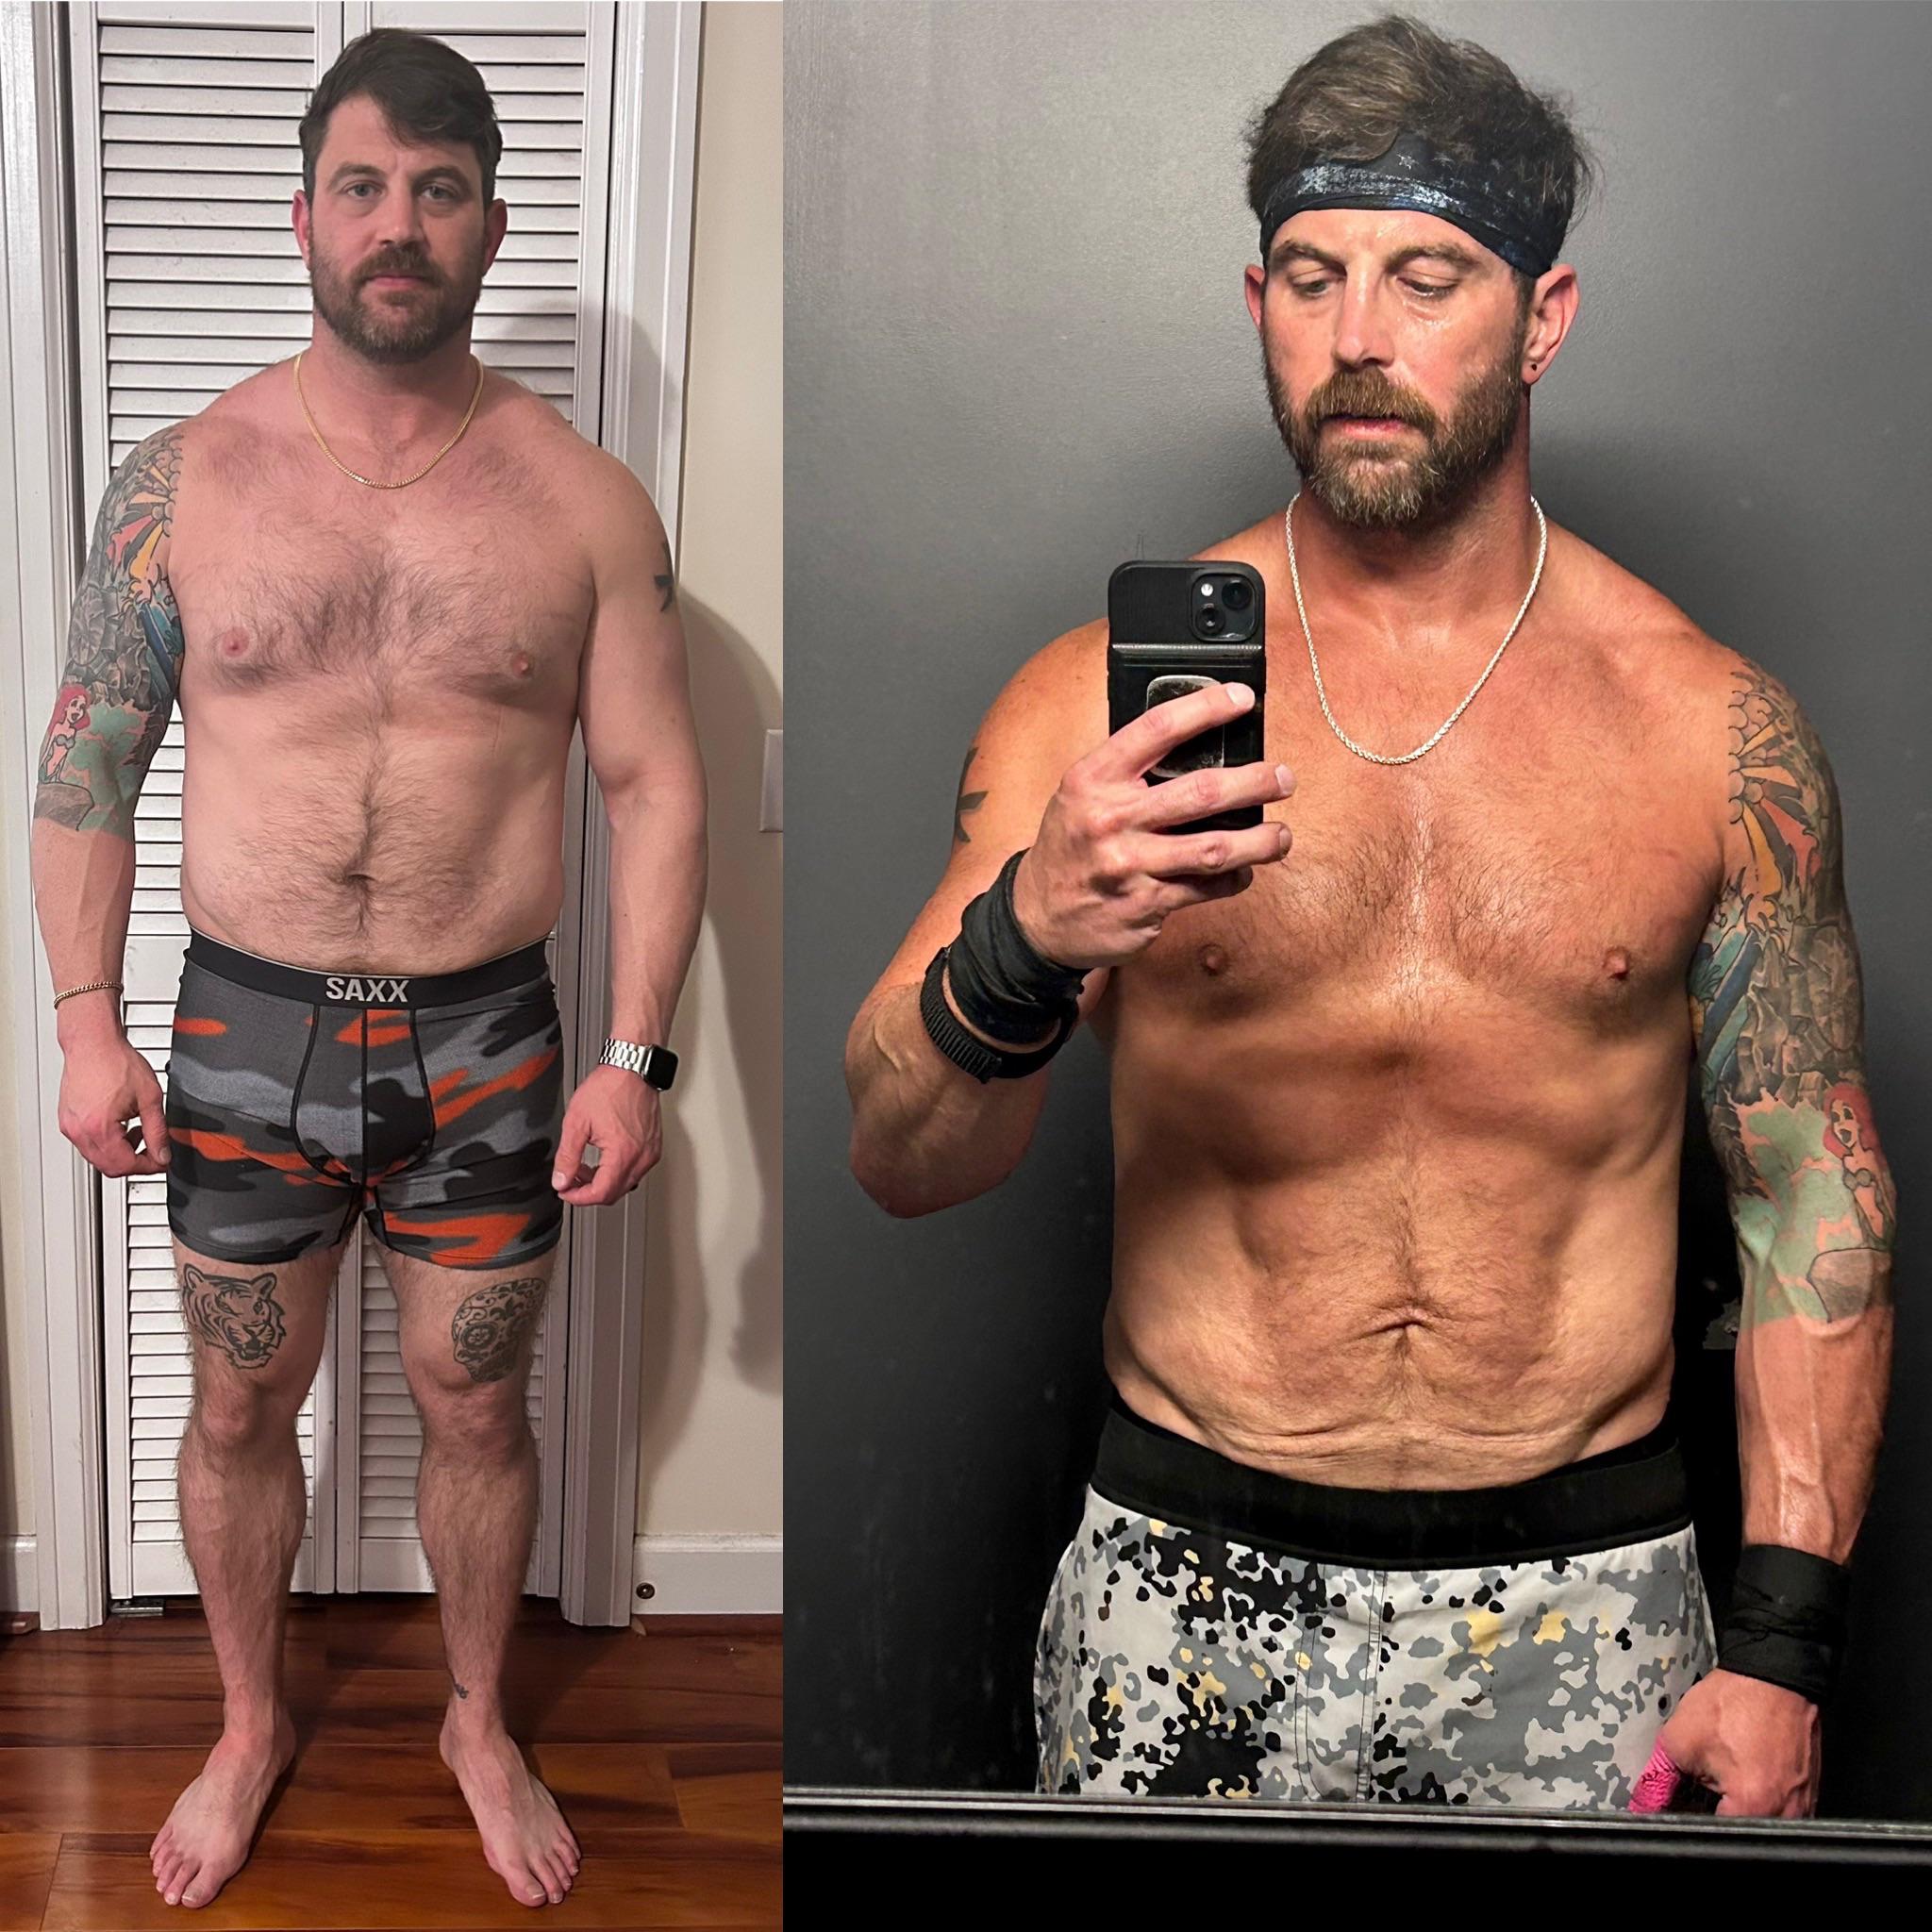
Retatrutide before and after — the clinical trial data
The retatrutide before and after data comes primarily from the phase 2 trial published in the New England Journal of Medicine. Here are the headline results across all dose groups at 48 weeks:
| Dose | Average weight loss | Patients losing >10% | Patients losing >20% | Patients losing >25% |
|---|---|---|---|---|
| Placebo | 2.1% | ~8% | ~2% | ~1% |
| 1 mg | 8.7% | ~35% | ~5% | ~2% |
| 4 mg | 17.1% | ~72% | ~35% | ~18% |
| 8 mg | 22.8% | ~90% | ~65% | ~45% |
| 12 mg | 24.2% | ~93% | ~75% | ~55% |
At the 12 mg dose, 93% of participants lost more than 10% of their body weight and 75% lost more than 20%. These are population-level statistics rarely seen in weight loss research. For context, a weight loss of 10% is the threshold at which most obesity-related health conditions show meaningful improvement. A loss of 20%+ is considered transformative. The retatrutide before and after data shows that the majority of users at the highest dose achieve transformative results.
Retatrutide before and after — realistic scenarios
Abstract percentages are hard to visualise. These representative scenarios illustrate what retatrutide before and after results look like at different starting points, using the average 24% weight loss at 12 mg. Remember: individual results vary — these are illustrations, not guarantees.
Before: 90 kg · BMI ~31 · UK dress size 18–20 or trouser waist 38–40″
After (48 weeks at 12 mg): ~68 kg · BMI ~24 · approximately 22 kg lost
What this looks like: Moving from the obese BMI range to the healthy range. Dropping 3–4 dress sizes or 6–8 inches from waist measurement. Visible transformation in face shape, neck, arms, waist, and thighs. This level of change is typically noticed by everyone who knows the person.
Before: 110 kg · BMI ~37 · UK dress size 22–24 or trouser waist 42–44″
After (48 weeks at 12 mg): ~84 kg · BMI ~28 · approximately 26 kg lost
What this looks like: Moving from class II obesity into the overweight range — a dramatic shift in body composition, mobility, and overall health. Dropping 4–5 dress sizes. Significant improvement in joint pain, breathlessness, and exercise capacity. The retatrutide before and after change at this starting weight is life-altering for most people.
Before: 130 kg · BMI ~43 · UK dress size 26–28 or trouser waist 46–48″
After (48 weeks at 12 mg): ~99 kg · BMI ~33 · approximately 31 kg lost
What this looks like: Moving from class III (severe) obesity to class I obesity — still overweight by BMI standards, but a 31 kg transformation that dramatically reduces health risks, improves mobility, and changes daily quality of life. Continued treatment beyond 48 weeks would likely produce further loss, as the trial weight loss curve had not yet plateaued.
Retatrutide before and after is not just about the weight on the scale — it is about the life that changes around that weight. Stairs that were impossible become manageable. Clothes that were aspirational become wearable. Confidence that was absent becomes present. The numbers tell part of the story. The lived experience tells the rest.
Patient perspectiveRetatrutide before and after — changes beyond the scale
The most meaningful retatrutide before and after changes are often the ones that do not show on the scale. The phase 2 trial measured several health markers alongside weight loss:
| Health marker | Before | After (12 mg, 48 weeks) |
|---|---|---|
| Waist circumference | Baseline | Significant reduction (specific cm data pending phase 3) |
| HbA1c (blood sugar control) | Elevated in diabetic/pre-diabetic participants | Meaningful improvement — some reaching normal range |
| Fasting insulin | Elevated (insulin resistance) | Significant reduction — improved insulin sensitivity |
| Liver fat | Elevated in many participants | Substantial reduction — glucagon pathway targets liver fat specifically |
| Blood pressure | Elevated in many participants | Improved alongside weight loss |
| Lipid profile | Elevated triglycerides common | Improved triglycerides and cholesterol markers |
What patients report beyond the numbers
- Reduced joint pain: Knees, hips, and lower back pain improve as weight decreases — every kilogram lost removes approximately 4 kg of pressure from the knee joints during walking
- Improved sleep: Sleep apnoea symptoms reduce or resolve. Overall sleep quality improves. Less snoring, less daytime fatigue.
- Increased mobility: Activities that were difficult or impossible — climbing stairs, playing with children, walking longer distances — become manageable again
- Improved mental health: Reduced anxiety about appearance, improved self-confidence, and a sense of control over health that may have been absent for years
- Reduced medication burden: Some patients are able to reduce or discontinue blood pressure medications, diabetes medications, or cholesterol medications under medical supervision as their metabolic health improves
- Changed relationship with food: The elimination of food noise — the constant background thoughts about eating — is described by many patients as the most profound change of all
Retatrutide before and after — when it becomes visible
| Timepoint | What you see | What others see |
|---|---|---|
| Weeks 1–4 | Scale moving slightly. Clothes feel the same. | Nothing visible yet. |
| Weeks 4–8 | Clothes feel looser. Face may look slightly leaner. | Close friends/family may notice. |
| Months 2–3 | Clear changes in mirror. Clothes dropping a size. | People start commenting. |
| Months 3–6 | Significant transformation. Multiple sizes down. | Everyone notices. “What have you been doing?” |
| Months 6–9 | Retatrutide before and after is dramatic. New wardrobe needed. | People you haven’t seen in months may not recognise you immediately. |
| Months 9–12 | Approaching maximum results. Body composition still optimising. | The transformation is complete in most people’s perception. |
Retatrutide before and after — compared to other GLP-1s
| Medication | Average weight loss | 100 kg patient “after” |
|---|---|---|
| Semaglutide (Ozempic/Wegovy) | 15–17% | ~83–85 kg |
| Tirzepatide (Mounjaro) | 20–25% | ~75–80 kg |
| Retatrutide | 22–24% | ~76–78 kg |
The retatrutide before and after results are comparable to tirzepatide at the highest doses and significantly better than semaglutide. However, retatrutide achieved these results in a shorter trial period (48 weeks vs 68–72 weeks for the major semaglutide trials) with the weight loss curve still declining — suggesting the true retatrutide before and after gap may be even larger with longer treatment.
Retatrutide before and after — how to maximise your results
- Follow the full titration schedule: 2 mg → 4 mg → 8 mg → 12 mg, with 4 weeks at each level. Skipping steps does not accelerate results — it increases side effects and reduces adherence.
- Prioritise protein: 1.4–1.6 g per kg of body weight daily. Protein preserves muscle mass during rapid weight loss, which protects your metabolic rate and improves the quality of your retatrutide before and after body composition — lean and toned rather than just smaller.
- Add resistance training: Even 2–3 sessions per week of compound exercises protects muscle, improves body shape, and increases the metabolic advantage of the weight you lose.
- Stay hydrated: 2–2.5 litres daily. Dehydration worsens side effects and can mask weight loss on the scale through water retention.
- Track consistently: Weekly weigh-ins at the same time, progress photos monthly, and waist measurements. The scale does not tell the whole story — photos and measurements capture the retatrutide before and after transformation more accurately than weight alone.
- Source quality product: Research-grade peptide quality varies. HPLC-verified purity of 99%+ with a Certificate of Analysis ensures you are getting the active compound at the concentration stated. Check our customer reviews for confidence.
Retatrutide before and after — reading online results with caution
Social media is flooded with retatrutide before and after posts — some inspiring, some misleading. Here is how to evaluate what you see:
- Exceptional results get shared; typical results do not: The person who lost 35% of their body weight posts about it. The person who lost 12% usually does not. The posts you see skew toward the top of the distribution, not the average.
- Timelines are often omitted: A dramatic before-and-after with no timeline could represent 6 months or 18 months. Without knowing the timeframe, you cannot calibrate your expectations against it.
- Other interventions may be involved: Some posters combine retatrutide with strict dieting, intense exercise programmes, or other medications without disclosing this. The retatrutide before and after result they show may not be attributable to retatrutide alone.
- Product authenticity is unverified: With research-grade compounds, there is no guarantee that the person’s product contained genuine retatrutide at the stated concentration. Their result — good or bad — may not reflect the compound’s actual performance.
- Lighting, angles, and clothing: Photos can be taken in ways that exaggerate or minimise visual change. Consistent lighting, same clothing, and standardised angles are the only way to create honest before-and-after comparisons.
The most reliable retatrutide before and after data is the published clinical trial results — not social media posts. The trial was controlled, measured precisely, and reported averages across the full participant group including both strong and weak responders. Use the trial data to set your expectations. Use your own photos and measurements to track your personal progress. And treat online transformation posts as interesting but inherently unverifiable.
Your retatrutide before and after story has not been written yet. The trial data tells you what is possible. Your choices — protein intake, exercise, consistency, patience — will determine where in that range your story lands. The medication creates the opportunity. You create the result.
Mymetabolism perspectiveResearch disclaimer: Retatrutide is not approved for human use by any regulatory body. It is currently in phase 3 clinical trials. Research-grade retatrutide products, including Synedica pen formats, are intended for research purposes only. The representative scenarios in this article are composite illustrations based on clinical trial data ranges — they are not specific individuals. The information in this article is for educational purposes and does not constitute medical advice. Always consult a qualified healthcare professional before starting any medication or research compound. Mymetabolism supplies research-grade peptides verified by HPLC at 99%+ purity with a Certificate of Analysis on every batch.
Common questions — retatrutide before and after
Write your own before and after.
HPLC-verified retatrutide at 99%+ purity, COA on every batch, free UK shipping. Vials and Synedica pen formats available.
Browse Retatrutide →